When you first access the Reports section for a form, you see the default report, that contains all form fields, shown in pie charts, in the order that they appear in your form. However, there are four types of reports that you can create:
- Chart
- Data Table
- Number
- Text
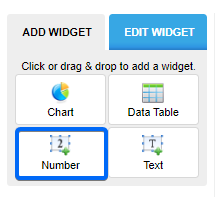
In this article, you will learn how to use the Number widget. This type of field allows you to create various functions between the numeric inputs from your submissions section. For example, the average age of your form users, how much money you have received through the whole form, the number of people registering to an event, etc. To get started, click on the green New Report button and name your report. Next, choose the Number widget.
Once clicked, you will see the report’s options in the left-side panel.
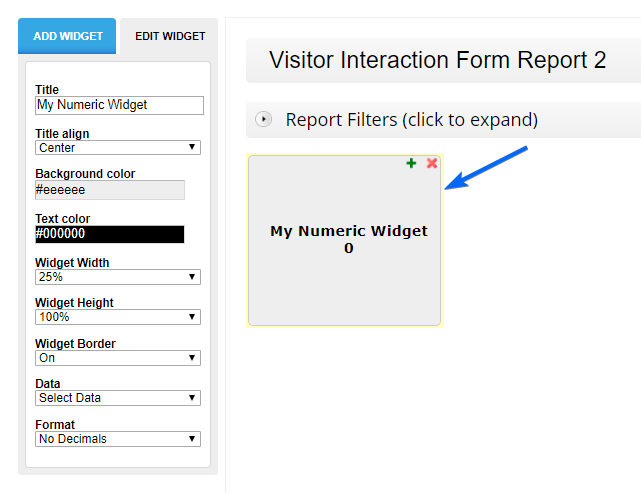
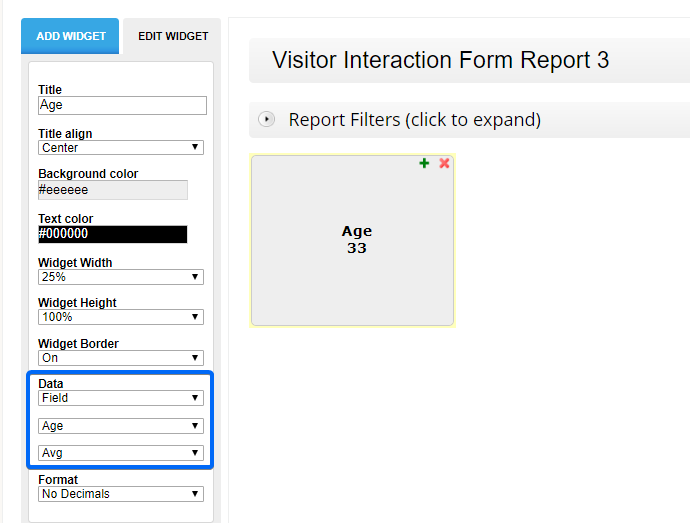
You will notice that there are several options available for customizing your reports. We will focus more on what you can compute. Keep in mind that you can use this widget only with number fields.
Field Inputs
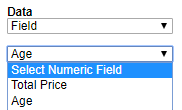
Navigate to Data and choose the Field option. Next, select your number field.
In the next step choose the function you need in the report:
- Count
- Max – show the maximum number
- Min – show the minimum number
- Sum – total the numeric inputs
- Avg – calculate the average number
- Median – compute the middle number of a set of data.
- Std – measure how spread out numbers are.
In the example below, we calculated the average age of form users.
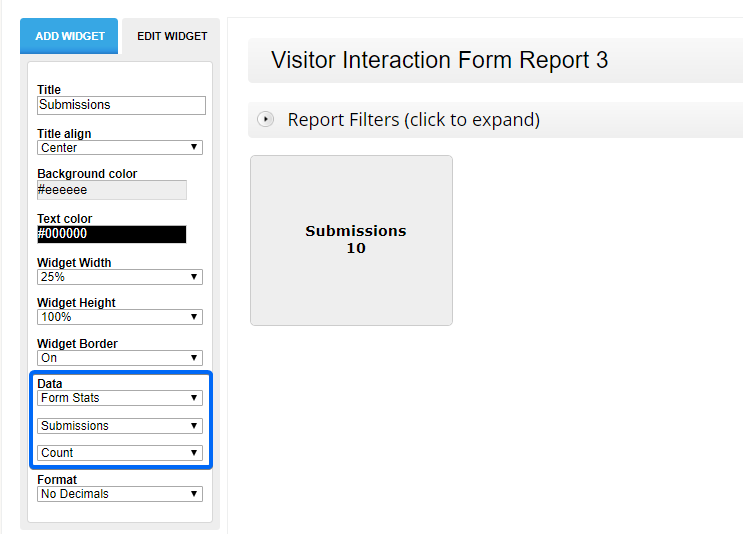
Form Stats
Navigate to Data and choose the Form Stats option. In the next step select Submissions from the dropdown list. This will count how many entry submissions you currently have collected.